
Hi, how do we decide, what standard deviation to use, when plotting random Ys using normal dist with mean as points on lin. reg. line.
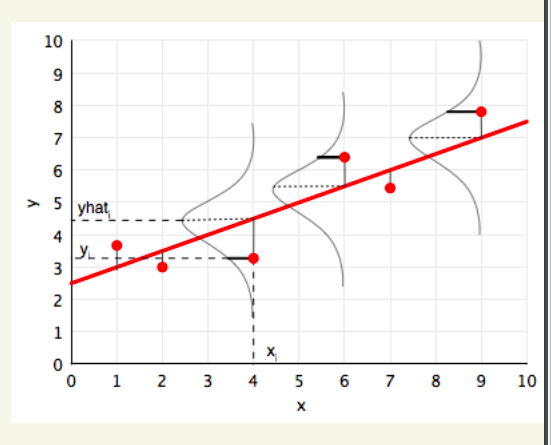
Given a regression line (the one in red)… I am trying to generate random gaussian data (corresponding to gussian curves as you see below)… the mean of these curves lies on the regression line… what sigma can I use? The idea is to plot the spread of points that this regression line can be used to generate.
Well, in the Bayesian framework the sigma values are also an output. It wouldn’t be a good idea to arbitrarily to set a sigma like that. However, in this case, the point is to use the MLE estimate of the variance, and not really deal with that framework.
Thanks @rgoswami
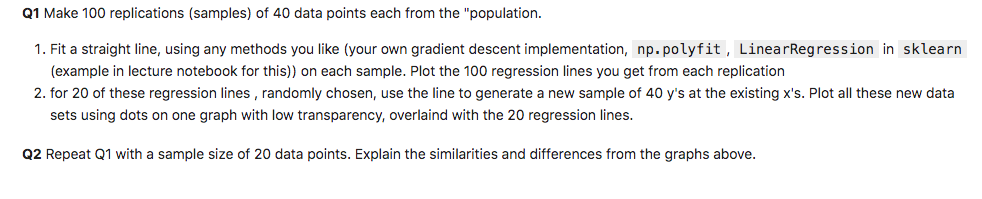
Actually I am working on this homework problem.
For part 2, I need to generate random new samples from existing x’s. So I am treating points on the regression line as means, and considering normal distribution, generating random samples. Since I have the mean (point on reg line), I need to understand if I can arbitrarily use any sigma value
As @rgoswami mentioned, you need to use the MLE estimate of the variance, which you can get by differentiating the log likelihoood wrt ‘sigma’. As it turns out, the MLE estimate of the variance turns out to be the sample variance. You should be able to find this in the DerivateDescent slides.